Getting My Websurfing Stastics into Grafana
You can never have too many tabs open (can you?)
TLDR: I made an extension that exports metrics about browsing habits. Download it on the Chrome Webstore here
Background/Lore
A while back I thought to myself, I wonder what a time distance graph of my websurfing would look like.
How does time affect tabs open? What about programming sessions? How do my habits compare to others? Who has the most bookmarks, the lowest attention span?
I'm running a public instance of metrics that the extension can report to, and if this gets any traction I would love to sit down and see if there anything neat about the human tendency to websurf.
Reporting Metrics
Prometheus gathers metrics through scraping endpoints, typically from endpoints it was configured for. This approach works well in enviroments where you control the endpoint and can expose a port to handle requests and serve statistics.
Unfortunately, Current Web Standards (AKA the fun police) doesn't allow Browser Extensions to bind to host ports to transmit arbitrary TCP data (unless its a Chrome App1) due to security restrictions.
Fortunately, Prometheus Pushgateway solves this problem. Acting as a middleman, Pushgateway allows for clients to push their metrics to it, caching them and exposing a endpoint for prometheus to scrape from.
This bridges the gap between Prometheus pull based architecture with push based reporting.
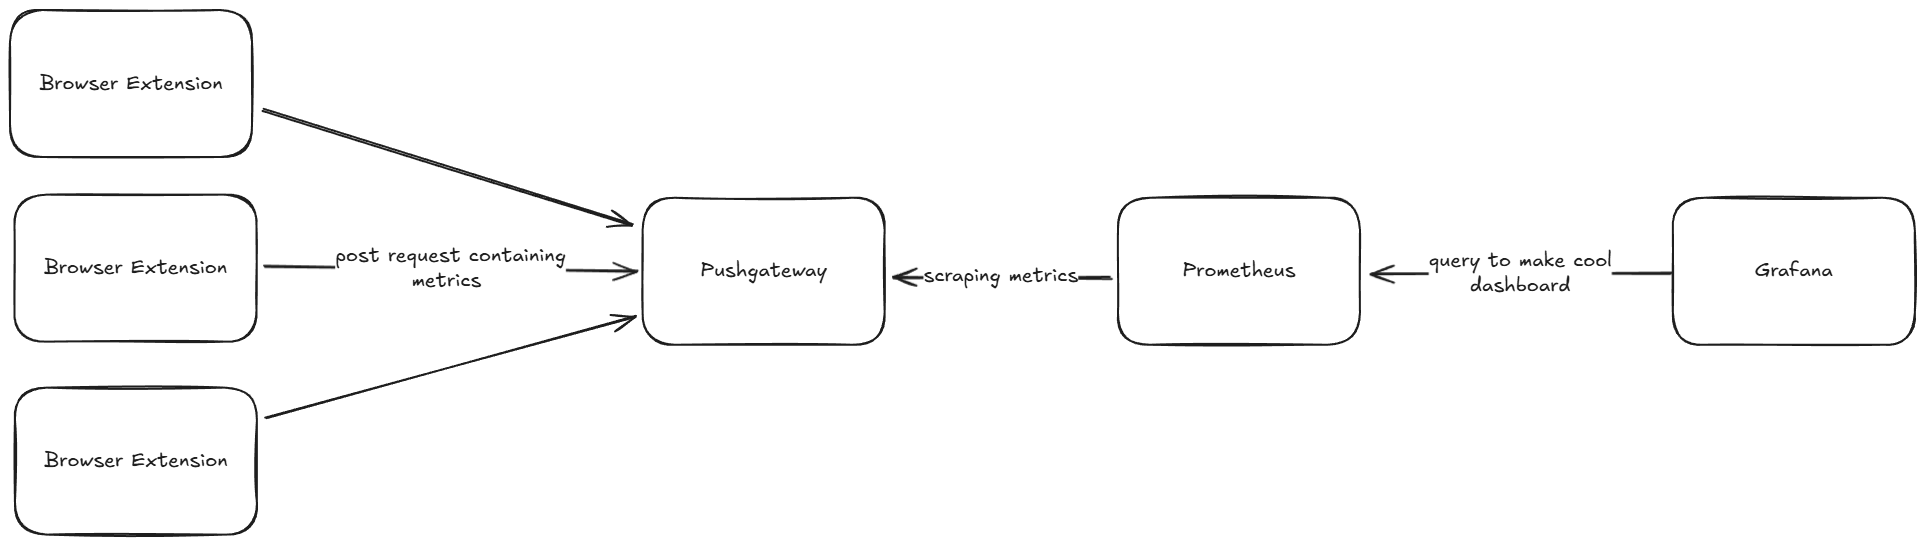 An architecture overview
Pushing Metrics to Pushgateway is also trivially easy. This is a example from Pushgateway's documentation
cat <<EOF | curl --data-binary @- http://pushgateway.example.org:9091/metrics/job/some_job/instance/some_instance
# TYPE some_metric counter
some_metric{label="val1"} 42
# TYPE another_metric gauge
# HELP another_metric Just an example.
another_metric 2398.283
EOF
Mini Thought2
The battle of CORS
I'd like to think I went into this not knowing how cors worked at all, and I came out with a masters in Cross Origin Resource Sharing
One of my problems early on when attempting to push metrics to Prometheus Pushgateway was these CORS errors.

But what is CORS preflight? Initally, my bad googling (and falure to actually read the extension api docs) led me to belive I needed to properly respond with CORS Headers to the preflight request.
This sidetracked me with learning how cors worked.
To understand what preflight is, I have to explain the entirety of cors. Simply put in caveman,
"Browser say, "Me no trust other domain!" CORS say, "Server give permission; me share resource now!'" 3
now that you know what CORS is, I can explain preflight. There are two types of CORS requests. simple, and preflight. To put it simply, simple requests are plainly to say, simple. they don't trigger CORS preflight, because they meet certain criteria
Preflight requests are born out of the need for the browser to check and see if the server even knows what CORS is. The Client/Browser sends a "preflight request" using the OPTIONS method, to determine if the server knows what CORS is.
If this call isn't returned with a A/OK from the server, You get a preflight error!
Or, put into the words of a Gymbro,
"Bro, preflight requests are like your warm-up sets at the gym—they check if the server’s cool with the big request before sending it, so you don’t pull a muscle (or break security). The browser’s just making sure everything’s good to go with permissions before hitting that heavy POST or PUT, ya feel? 💪"
None of this tangent was actually related to my problem however. It turns out I just needed to add a value in my manifest file so I could ask the user for permission to use the internet.
Cool Queries in Grafana
PromQL is really powerful, even though the oneline syntax can look ugly at points. I don't feel like i'm performing for speed though when I write queries, unlike using timescale.
if you want to make a variable over time graph, its as easy as just the name of the metric
browser_tabs_open
you can also define filters, so you only get certain labels in your response.
browser_tabs_open{uuid="062beeac-c05b-4526-bc9b-e959d21479ab"}
its just as easy to do literaly anything else in promql for making graphs to other cool data breakdowns.
Learnings from my own statstics
I took a snapshot of my last week while writing this post, you can see it here. Looking at this, I definetly get stressed out from leaving tabs opened, as I try to get back down to zero every night. you can also see my abuse of the bookmark button instead of the reading list too, I hope to trim that list down soon with hoarder
If you couldn't tell, some statistics are broken, but thats future me's problem, not me right now.
Setting up for selfhosted use
I sure don't want my data to be forced onto someone else's cloud4, so its possible to specify your own Prometheus Pushgateway, but The host permission does force https:// so hopefully you know how to do ssl.
Call to action
you should totaly download my extension, brah. even if you don't report your metrics to me, I'm curious to see what other habits people find/notice about their websurfing.
I'm still on my quest to make the most useless dashboard possible, but until then, If you see (or) make something cool, @ me.
Footnotes
- Sadly Chrome apps were deprecated back in 2020 ↩
- (port scanning 9091 and then trying this would be funny attack vector) ↩
- (This is the only proper use of LLMs btw) ↩
- my homelab is more of a cloudlet, that frequently loses power. ↩